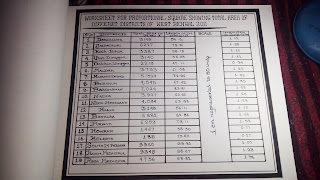
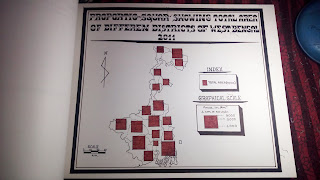
GEOGRAPHY PRACTICAL :- SQUARE DIAGRAM
PROPORTIONAL SQUARE

•DEFINITION :- Square diagram are 2 dimensional consisting of a series of squares proportional in size to the quantities they represents. Depending on the nature of data square diagram may be constructed in two ways :-
(i). Simple square diagram or proportional squire diagrams where data with only one component is available and each square represent a single value.
(ii). Compound square diagrams when the comprise more than one component and each square is proportionally divided into rectangular segment to show the construction parts.
• PRINCIPAL :- The construction of square diagram is based on the principal that the are of a square(a) for a responsible item (i) directly proportional to the quantity of the item(q) to be shown.
• METHOD :- Square diagram is drawn by following the step :- One side of square is simply the square root of the data r2 = x ( where 'x' number of household and house. Or r = √x.
• USE :- Square usually represents the number of household and house etc.


Comments
Post a Comment